What’s a good Pay by Bank conversion rate?
The news that global financial technology platform Adyen is launching its own Pay by Bank solution with Tink shows how quickly it’s gaining mainstream adoption – and just how competitive the user experience has become. In this post we go deep on open banking conversion rates – and show how today’s benchmarks are already higher than you might think.
Comparing conversion rates across different payment methods can be tricky since most don’t use an end-to-end metric.
There’s variation across markets and use cases, but Pay by Bank conversion rates are already very competitive.
This post goes in-depth into open banking conversion rates and guides you in finding the optimal service provider.
What we mean by ‘conversion’
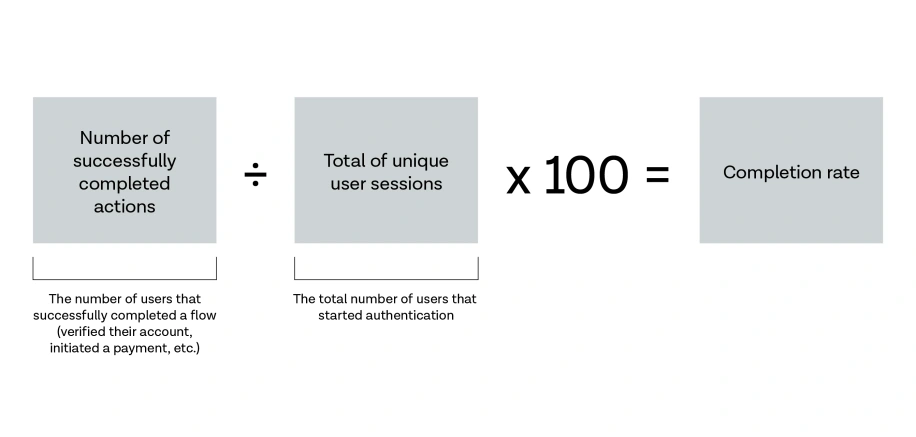
The tricky part about assessing an open banking conversion rate is that not all providers define it in the same way. You may see terms like success rate, conversion rate, and completion rate used almost interchangeably. At Tink, we use an end-to-end metric referring to the percentage of users that complete an open banking flow – make a payment, connect a bank account, or both. We call this the completion rate.
It’s tempting to compare this to the performance metrics of other online payment methods, like card authorisation rates. You wouldn’t be comparing apples to apples. Most other performance metrics typically only account for the final authorisation step and not the full user journey, leaving out the steps associated with data entry – such as entering your card details.
Tink’s completion rate metric also takes into account the authentication flow in the bank’s own interface – including any bank-side errors. This is because we believe that for a metric to be useful it has to accurately measure real-world conversion and the value that Tink delivers. Plus, we invest significant resources in optimising for less-than-perfect bank flows and proactively suggest improvements to banks across Europe, so this metric helps show the impact of that work, too.
Questions to ask your provider:
How do you define your conversion metric?
Do you include bank errors when measuring conversion rates?
How effective are you in engaging with banks to improve their flows?
How to measure your conversion rate
At Tink we track conversion across every step of the flow: from the moment a user selects open banking as a means to pay (PIS) or connect an account (AIS), up to the action being completed. In a payments context, we start measuring conversion as soon as a user selects Pay by Bank as a payment method and is redirected to Tink.
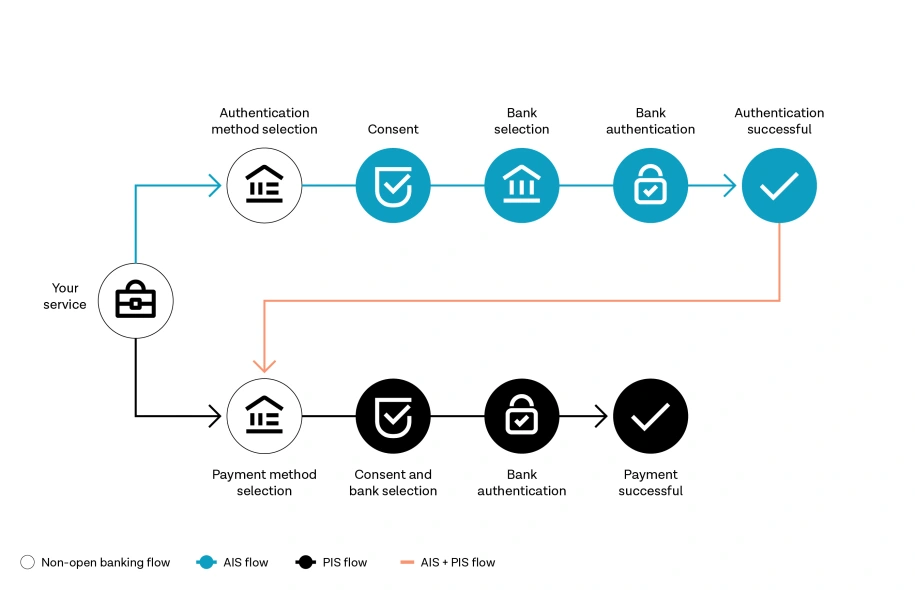
Examples of open banking flows, showing a typical AIS, PIS, and AIS + PIS flow.
Open banking flows typically consist of 3-5 screens and it’s crucial to measure conversion rates on each one individually. Using reports and analytics inside the Console, Tink customers can drill down to see how many users started the flow, how many proceeded to authentication, and how many completed the flow successfully. This gives you quick insights into where to optimise the flow.
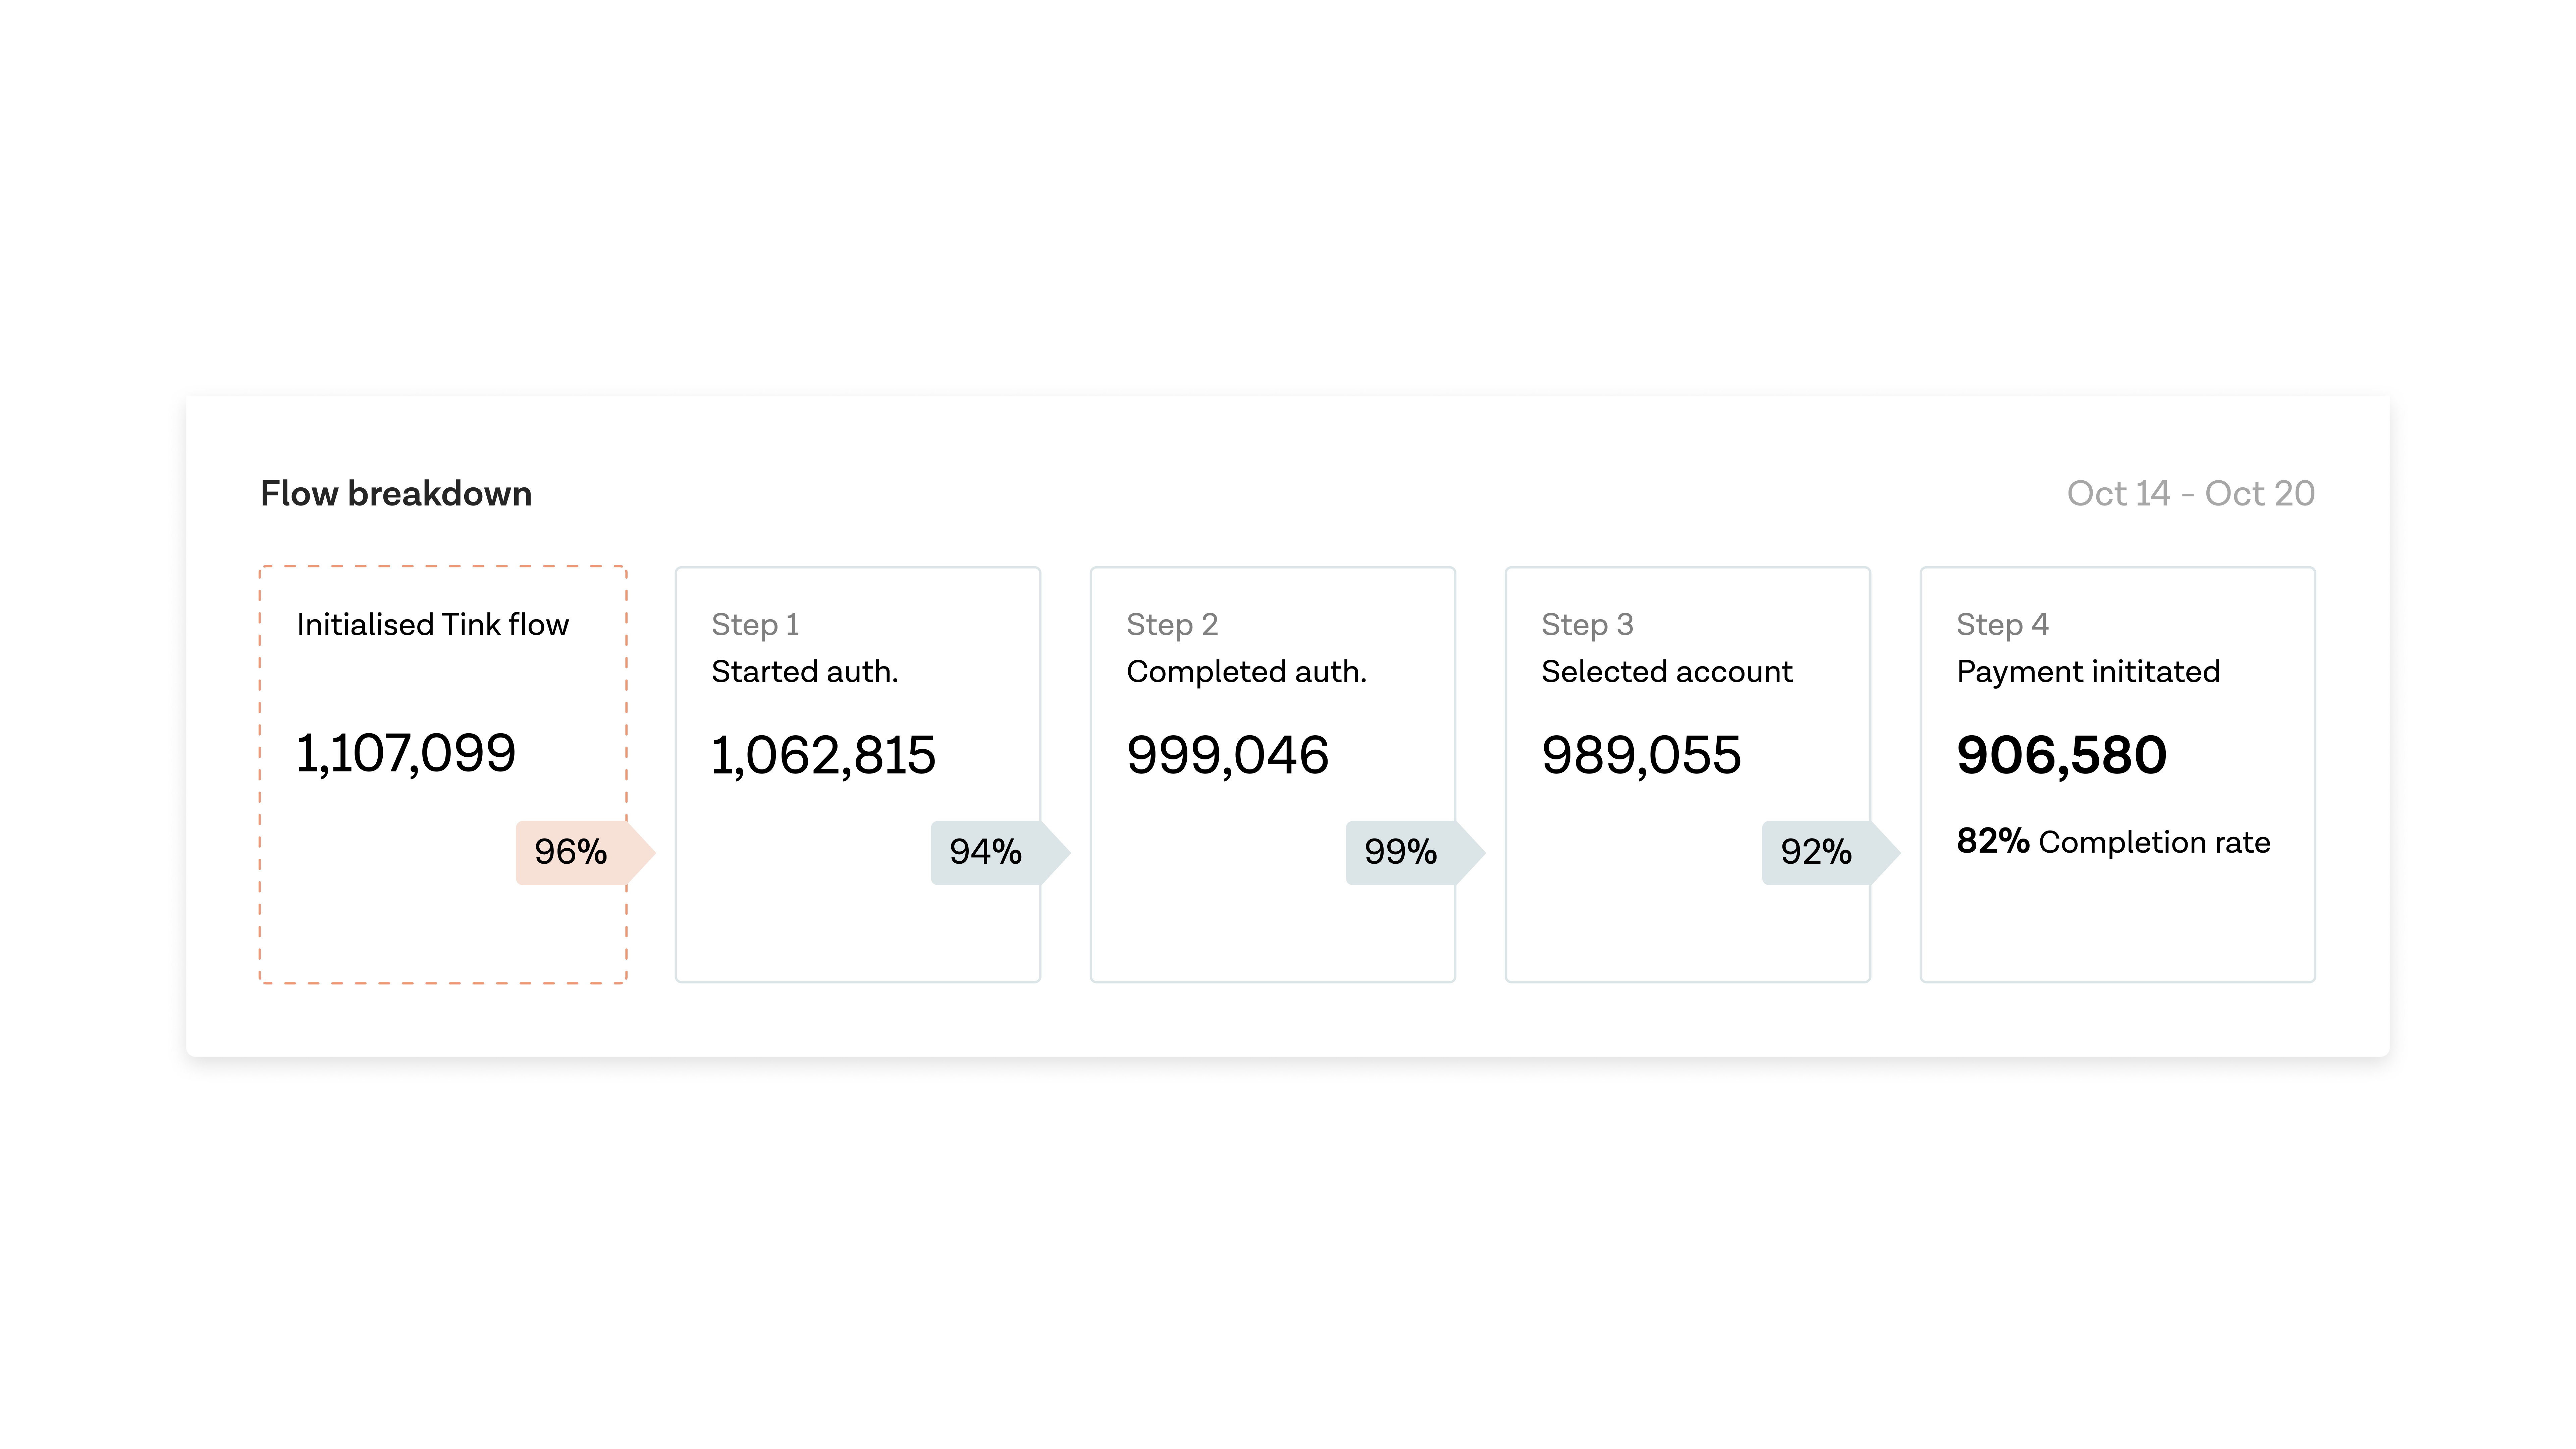
Reports like this in the Tink Console help let you track and analyse the completion rate across each step of an open banking flow.
Of course, an open banking flow is just one part of your broader user journey, which is why it’s key to optimise the end-to-end journey and the steps on either side of your open banking flow in particular.
Questions to ask your provider:
What tools are available to track and analyse conversion rates?
Do you measure conversion rates at each individual step of the flow?
Minimal error rates
On average, technical or bank-side errors contribute a tiny fraction of overall conversion loss when it comes to open banking payments. The biggest source, as with any payment method, is user drop-off – typically accounting for 90% of lost conversions.
The good news is that you can minimise drop-off through UX optimisation and A/B testing. In fact, Tink customers are able to customise their payment flows to a greater degree than with almost any other payment method – read our UX guide to learn how. All Tink-owned flows are continuously optimised by our engineering and design teams, too.
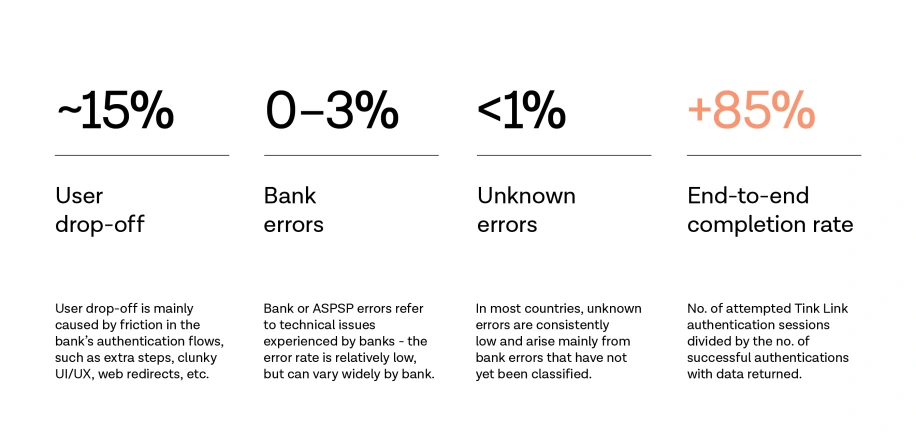
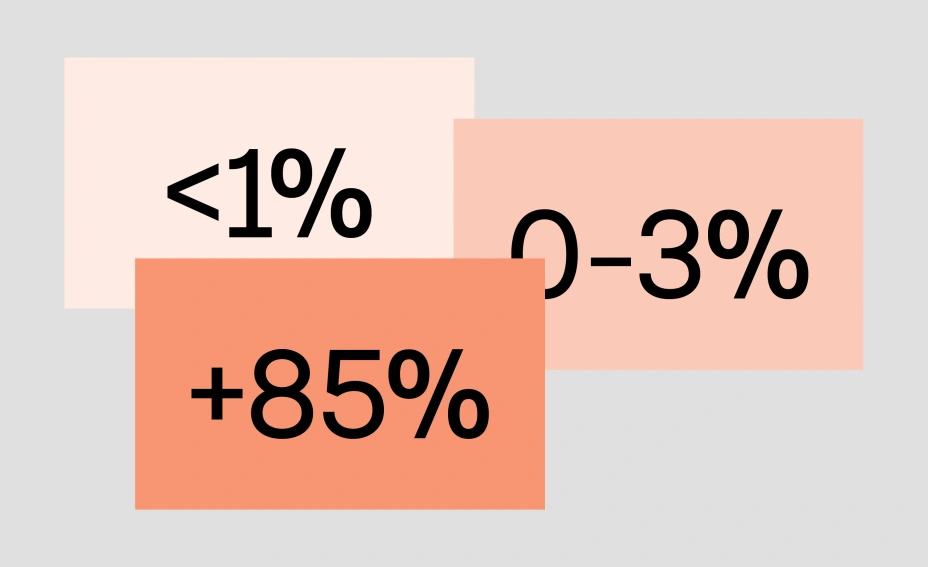
A typical breakdown of error types that a Tink customer sees given an end-to-end completion rate of 85%.
Though bank error rates are low on average, API reliability and the usability of bank customer interfaces can vary across Europe. Meaning bank errors are likely to be higher in some countries than others. This is changing though, with second-wave markets like France, Germany, Italy, and Spain seeing volumes increase rapidly. At Tink, we engage with banks across all our markets on a regular basis to notify them of any issues and suggest improvements.
To help optimise for bank errors as best as possible, Tink customers get full visibility into how individual banks are performing inside the Console. Conversion data, including error rates, are broken out per bank for each step in the flow. You can use this to spot low-performing bank flows and optimise your bank selection list, for example, or troubleshoot possible issues together with the team at Tink.
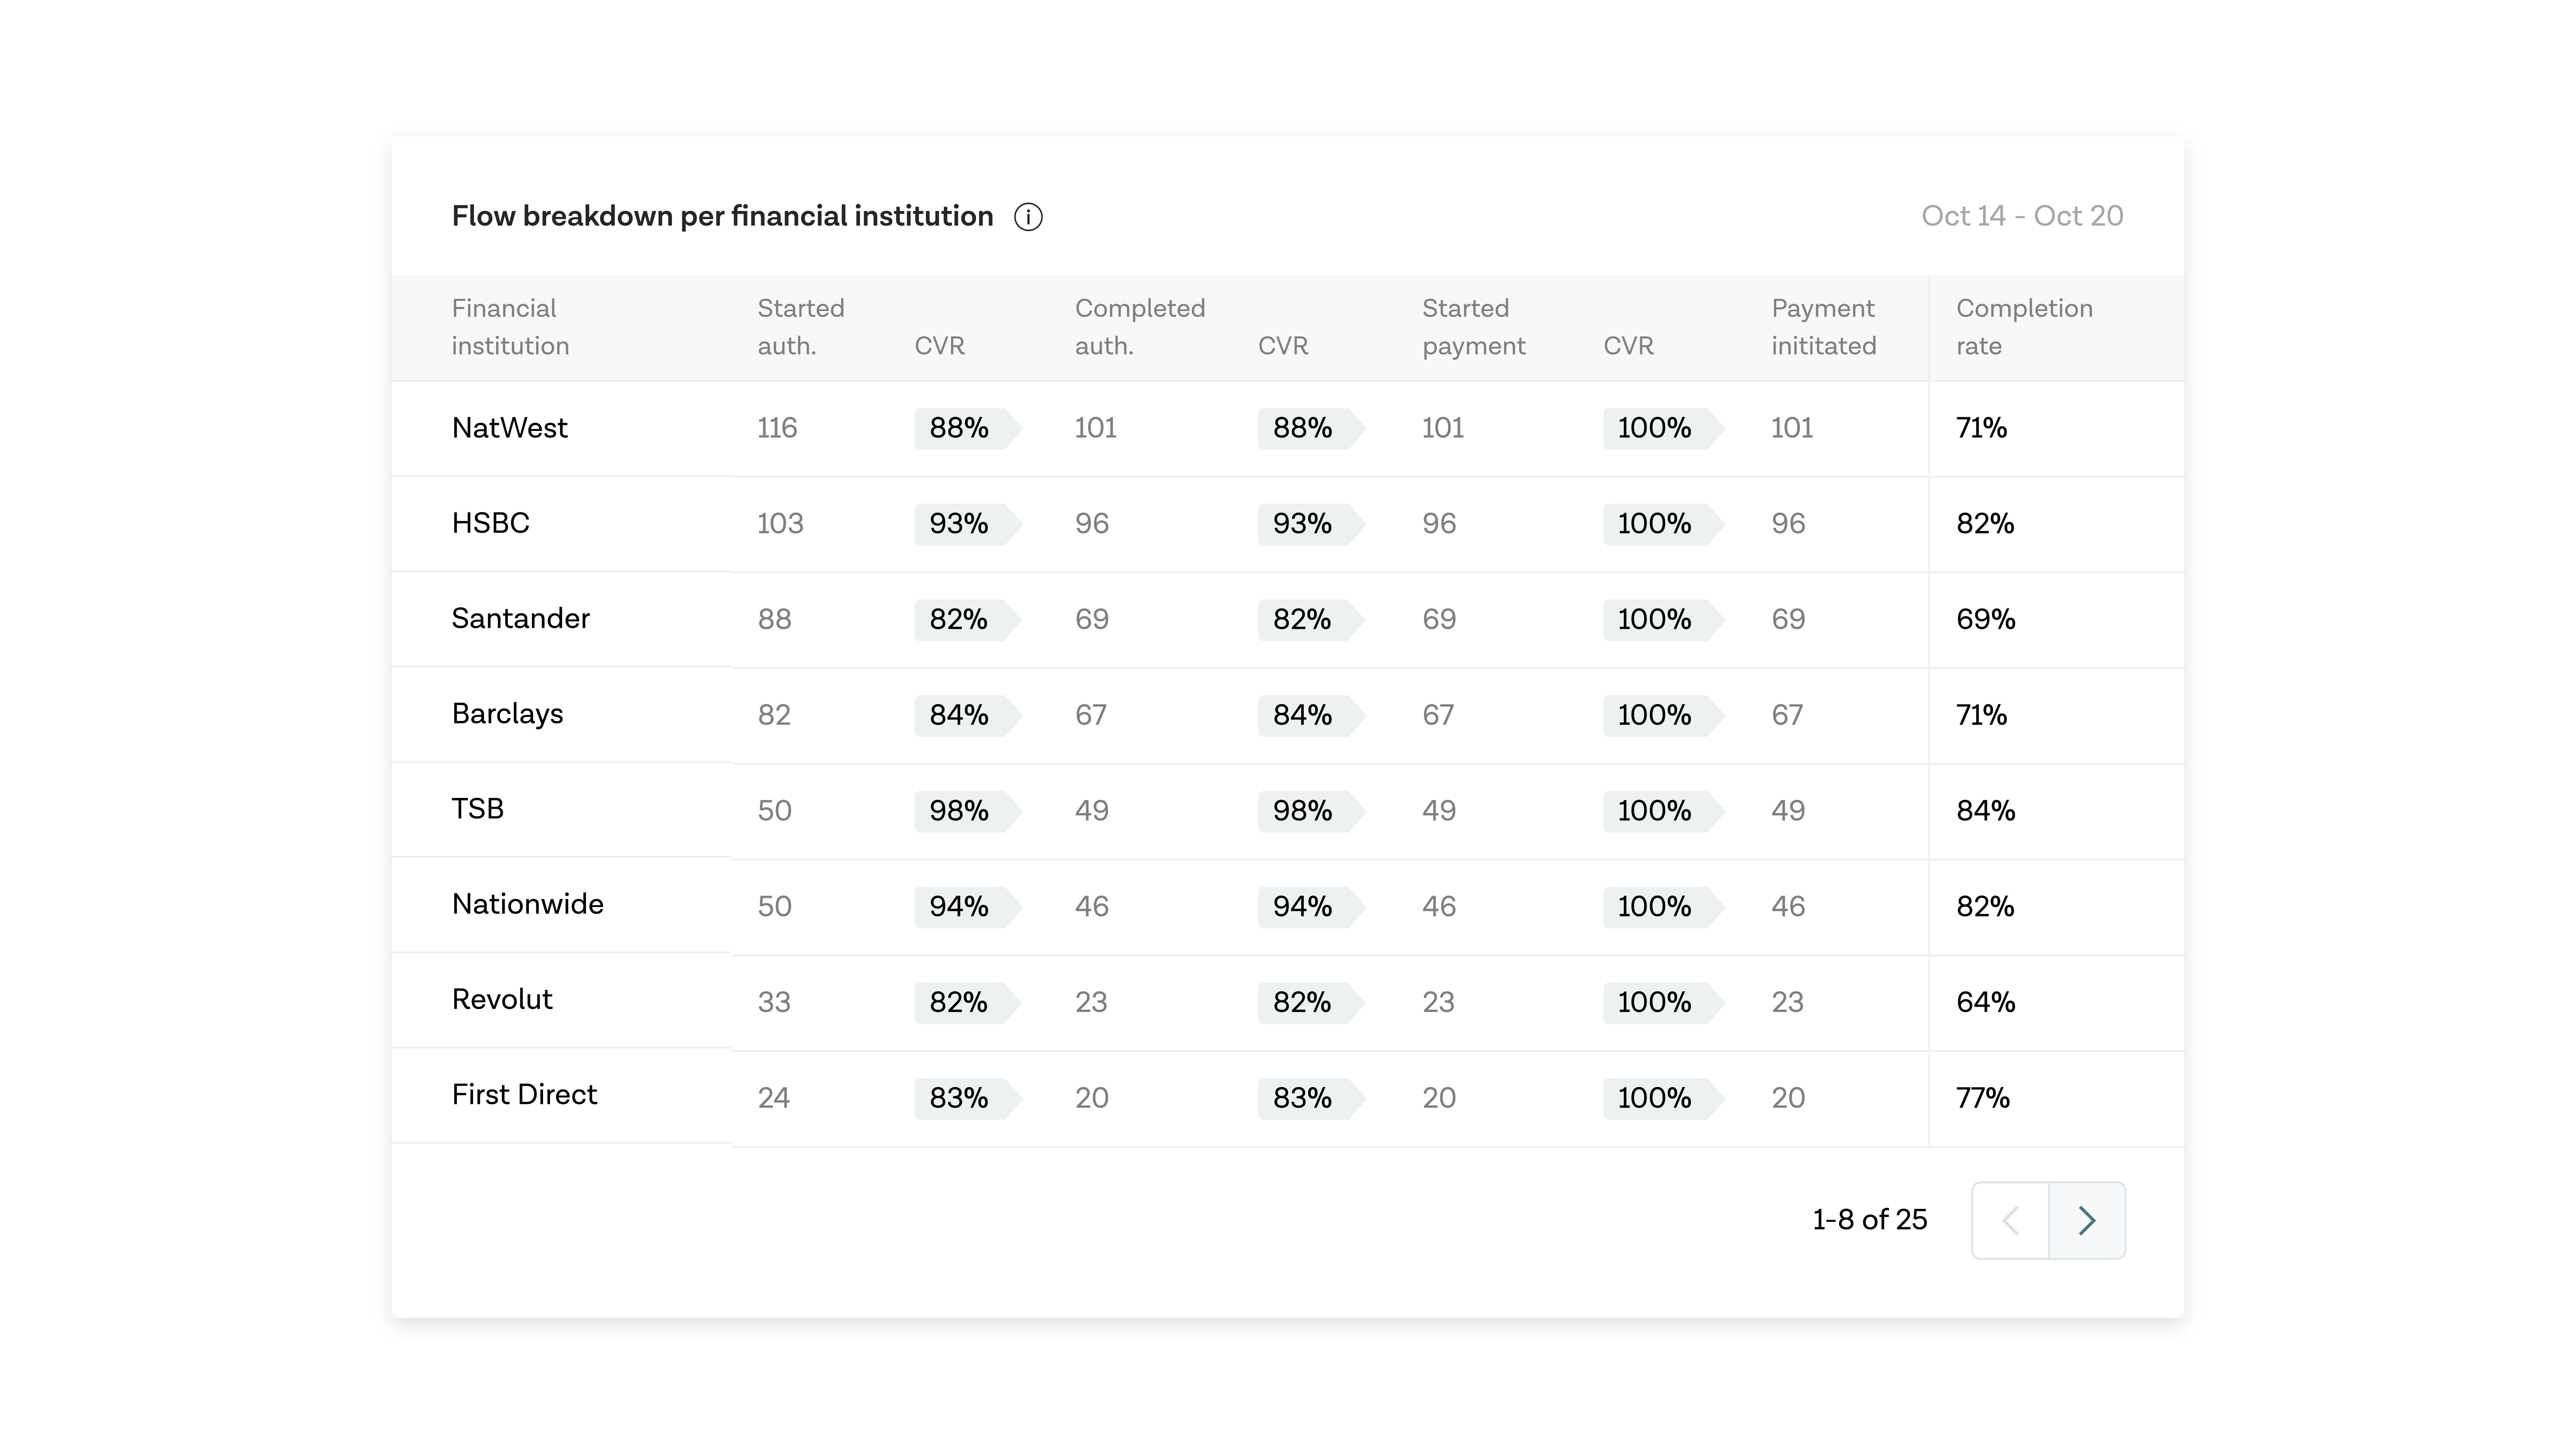
One of the bank-specific performance reports in the Tink Console – the data used is for illustrative purposes only.
Questions to ask your provider:
What’s your error reporting process?
How do you work to minimise bank errors?
Do you have a status page showing your platform’s historical uptime?
The all-important conversion rate benchmark
Unsurprisingly, there is no single Pay by Bank conversion benchmark since it differs by market, industry, and use case. For Tink customers, 80-90% is the average range for first-time users in mature markets like the UK and Nordic countries, rising to above 90% for returning users. Making direct comparisons with other payment methods is tricky since they don’t measure end-to-end performance, but Pay by Bank generally performs on par with or better than the alternatives in mature markets. Conversion rates in second-wave markets like Germany and France are lower but rising fast.
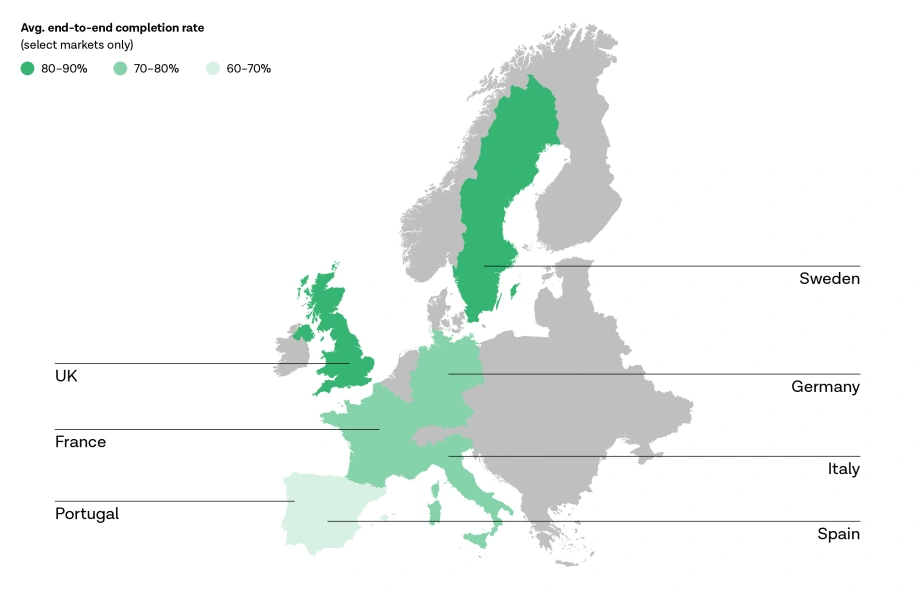
Average Pay by Bank conversion rate ranges in select markets, based on Tink data collected Sep-Oct 2022.
A key thing to note here is that open banking conversion rates are constantly improving as volume increases, banks optimise their flows, and new regulations come into play. At Tink we fundamentally believe that Pay by Bank has a higher performance ceiling than other alternatives – and we expect conversion rates to increase faster over time. We can already see this happening in the UK and Sweden, for example.
Conversion rate benchmarks vary by industry, too. This shouldn’t be too surprising since there are different user motivations at play. Whether the use case is repaying a loan, topping up an account, or buying something online, the action you want a user to take and their reason for doing so is different. Someone trying to pay a bill on time likely has a higher intent to pay than someone buying a pair of shoes.
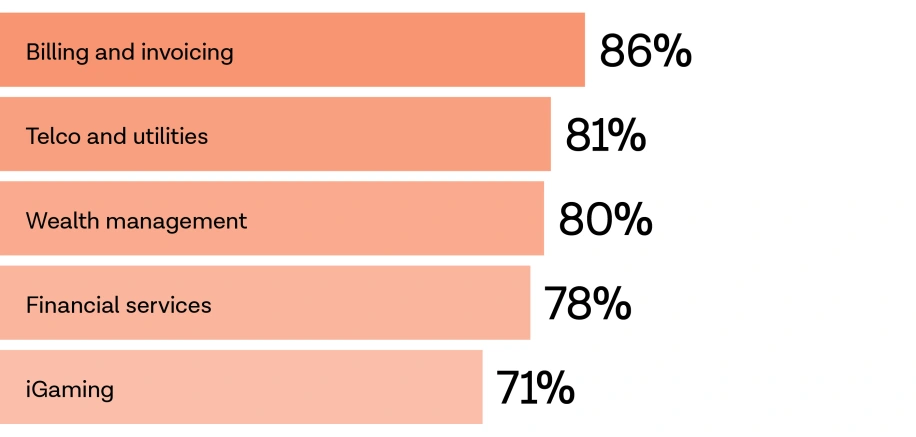
Average Pay by Bank conversion rates in select industries, based on Tink data collected Sep-Oct 2022.
Questions to ask your provider:
What’s your average end-to-end conversion rate for businesses like ours, in the markets that are important to us?
How are your average conversion rates changing over time?
What initiatives do you have planned to help us increase conversion?
Regardless of the market and industry you’re operating in, there’s always room to improve your conversion rate. And with Tink Payments you have greater control over the flow than any other payment method, letting you do things like pre-populating user information, merging steps, and customising the flow to your brand’s colours, typography, and logo to create a consistent look and feel.
If you’re looking for more conversion optimisation tips, our Product Design team has neatly summarised their learnings from past experiments in this UX guide.
More in Open banking

2025-11-20
3 min read
Tink powers the UK’s first cVRP transaction with Visa A2A
In partnership with Visa, Kroo Bank, and Utilita, we’ve just helped demonstrate the UK’s first commercial variable recurring payment (cVRP) using the Visa A2A solution – and it’s a big step forward for how people make regular payments.
Read more

2025-06-09
11 min read
The case for “Pay by Bank” as a global term
Thomas Gmelch argues that "Pay by Bank" should be adopted as a standard term for open banking-powered account-to-account payments to reduce confusion, build trust, and boost adoption across the industry.
Read more
2025-06-02
3 min read
Tink joins Visa A2A – what it means for Pay by Bank and VRP
Visa A2A brings an enhanced framework to Pay by Bank and variable recurring payments (VRP) in the UK, and Tink is excited to be one of the first members of this new solution.
Read more
Get started with Tink
Contact our team to learn more about what we can help you build – or create an account to get started right away.